Named spots
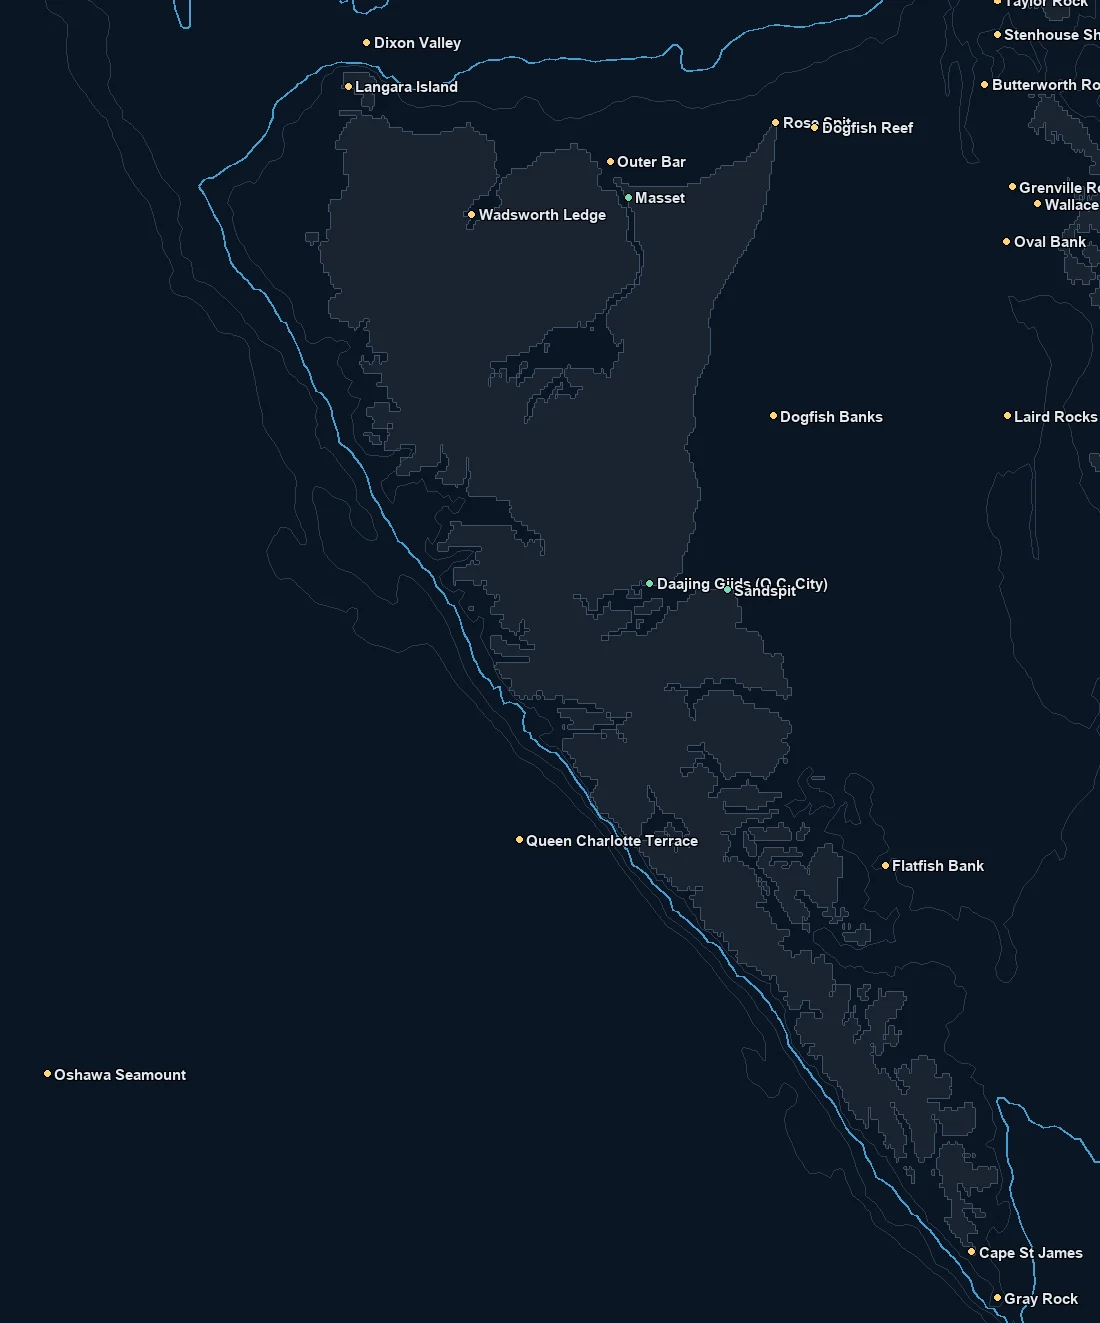
| Spot | Type | Depth | From nearest port |
|---|---|---|---|
| Daajing Giids (Q.C. City) | port | – | 9 nm |
| Masset | port | – | 46 nm |
| Sandspit | port | – | 9 nm |
| Bar Rocks | bank | 2 fm | 8 nm |
| Bonilla Rocks | bank | 2 fm | 45 nm |
| Borrowman Shoals | bank | 7 fm | 17 nm |
| Butterworth Rocks | bank | 26 fm | 43 nm |
| Cape St James | headland | 17 fm | 83 nm |
| Cumshewa Rocks | bank | 5 fm | 16 nm |
| Denham Shoals | bank | 104 fm | 23 nm |
| Dixon Valley | canyon | 228 fm | 35 nm |
| Dogfish Banks | bank | 7 fm | 21 nm |
| Dogfish Reef | bank | 9 fm | 23 nm |
| Flamingo Rock | bank | 45 fm | 38 nm |
| Flatfish Bank | bank | 46 fm | 37 nm |
| Freeman Rock | bank | 49 fm | 33 nm |
Nearby buoys
2026-10-30 23:00 UTC · NOAA NDBC 46147
2026-10-30 23:00 UTC · NOAA NDBC 46208
2026-10-30 23:00 UTC · NOAA NDBC 46183
2026-10-30 23:00 UTC · NOAA NDBC 46205
2026-10-30 23:00 UTC · NOAA NDBC 46145
Latest NOAA NDBC observations. Satellite and in water readings may differ.
Fishing Haida Gwaii
Haida Gwaii is remote, big-fish water, and the chart is built to help you read it from the famous salmon tide lines to the offshore banks. You fish out of Masset, Sandspit and Daajing Giids and work the legendary ground around Langara Island, Cape St James and Rose Spit, plus the halibut banks of Hecate Strait and Dixon Entrance. Across all of it the productive water sits where upwelling, tide lines and temperature edges concentrate bait against the islands and the structure.
Read the chart as layers that work together. SST breaks mark the seams where cool, upwelled water meets warmer water around the points and out over the banks. Chlorophyll color changes show where green, bait rich water edges against cleaner blue. Depth structure, the banks and the offshore shelf, gathers that life into a smaller area. When a break, a color edge and a piece of structure line up, that overlap is where you start looking.
Chinook salmon are the headline fishery, with Langara Island among the best known grounds anywhere, backed by coho, big halibut on the banks, and lingcod and rockfish on the structure. Albacore show offshore in warm years. The fish follow the bait and the moving water, so the chart is intelligence for reading where the water is setting up, not a promise that fish are on a given edge today.
Treat this as a planning tool and not for navigation. This is remote, exposed water, so check the marine forecast, confirm current regulations and closures with Fisheries and Oceans Canada, and run it with local knowledge.
What you get with ReelTemps
- Sea surface temperatureFind the temperature break
- Chlorophyll-aSpot the green-to-blue color seam
- Composite & single passBlended picture or the freshest overpass
- CompareTemperature and color side by side
- Depth readoutFathoms and feet on hover, tap or mark
- Currents & buoysSee the water move and ground-truth it
- Route, ruler & waypointsPlan the run and save your spots
From the water
I've tried every temp map out there and they all feel like they were built ten years ago. I'm not exactly a tech guy, but this one actually makes sense the second you open it. First time using it, I marked a break in about 30 seconds the night before and boated bluefin right on it the next morning.
Used to burn half a tank driving around looking for color change or a solid temp break. Now I check ReelTemps before I leave the dock and I know exactly where I'm going. Less time driving around guessing, more time with lines in the water. The weather forecast is always spot on too!
Albacore season used to mean a couple hours of homework the night before and just hoping it held up. Now I do most of my research that morning and pull it up on my phone if things change once we're out there. Makes calling an audible a lot easier.