 Satellite fishing charts
Find the temperature break.
High-resolution sea-surface temperature, chlorophyll, and a cloud-free view — blended from every satellite overhead and drawn on one map you can actually read. Built for the offshore fleet.
53 regions · the U.S. coast, the Great Lakes, Hawaii, Baja, mainland Mexico and the Caribbean.
- 1 Satellites collect the data Every pass overhead — VIIRS, GOES & more — gathered around the clock.
- 2 Our models process it Proprietary compositing blends the passes, rejects the junk, fills the gaps.
- 3 You mark the spot Read the break, drop a waypoint, lay your course — right in the browser.
- 4 Go catch the fish Run straight to the water that holds bait — less fuel, more lines wet.
One pass isn't the whole picture.
A single satellite overpass is half cloud and swath gaps — and just one moment in time. Our models blend days of passes into one complete, current, buoy-calibrated field. Drag the handle to see the difference.
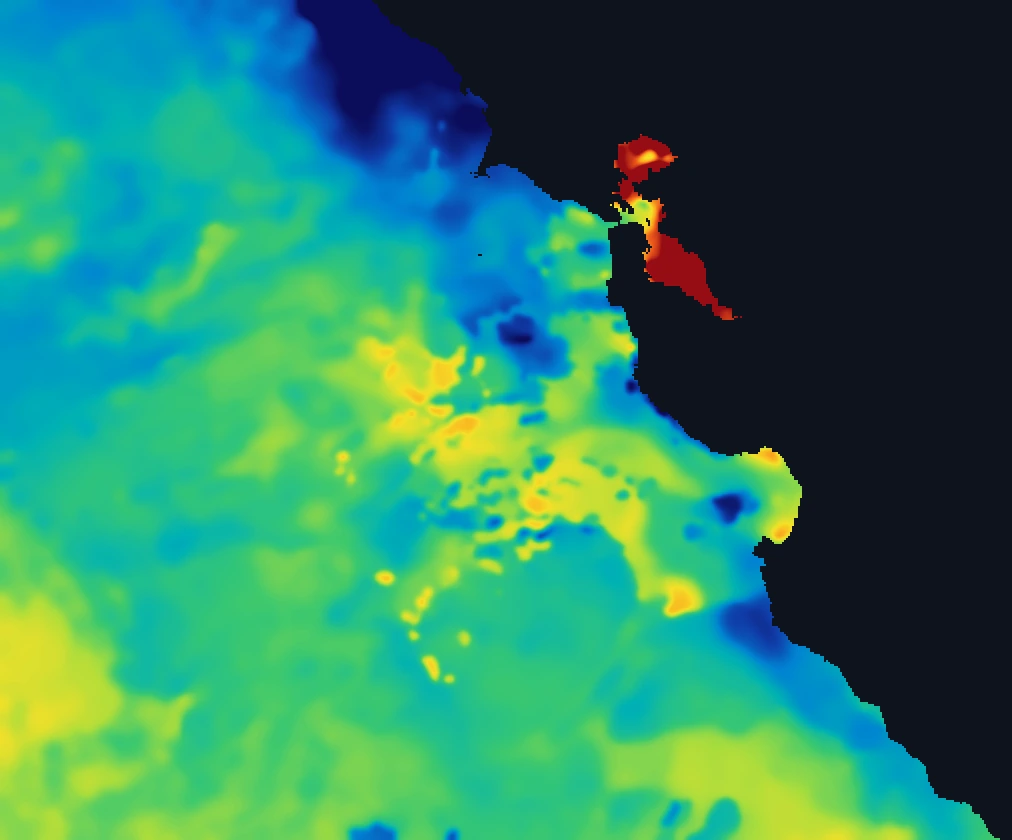
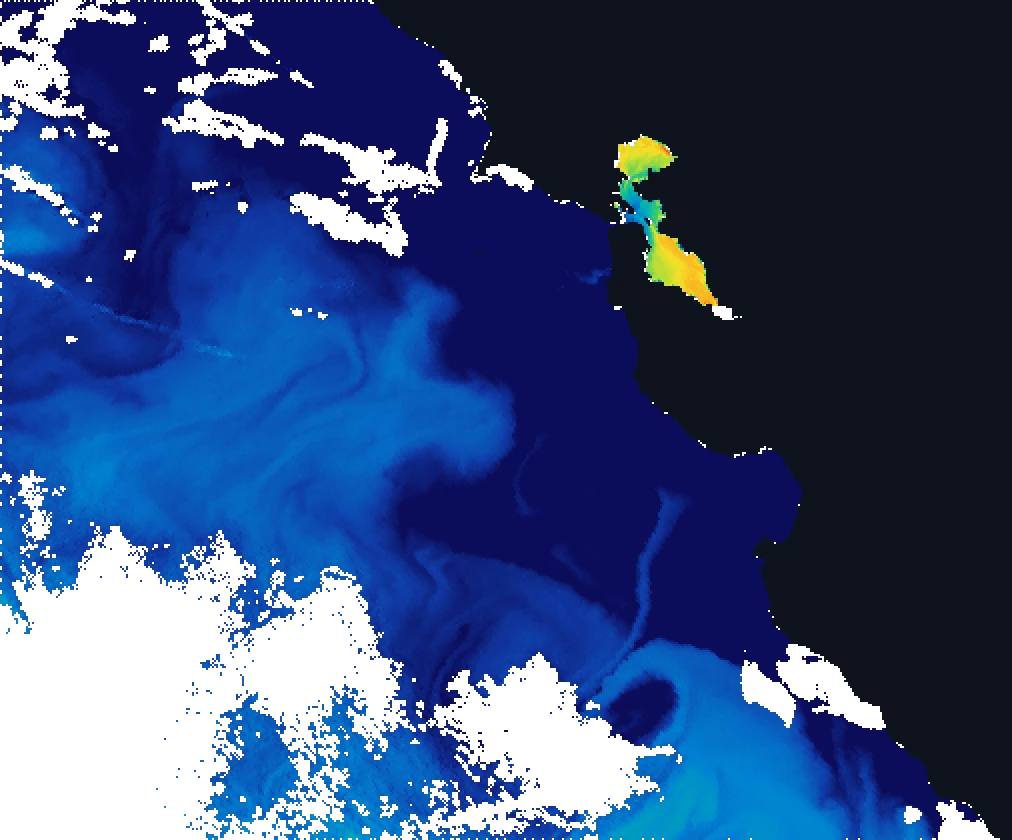
Left: a single VIIRS overpass. Right: the ReelTemps composite — same water, same color scale, days of passes blended into one clean field. Real demo data, deliberately frozen.
The whole ocean, honestly rendered.
Every satellite pass blended into one coherent picture — no invented color, no fake gradients. Just the water, the way it is, with the tools to read it.
See the break before you burn the fuel.
A recency-weighted composite blends days of passes by freshness and rejects the outliers, so the break reads as one clean edge — not a checkerboard of stitched swaths. Step through single passes when you want the raw look.
- Recency-weighted composite & single-pass stepping
- Buoy-calibrated to the NDBC network
- Pan, zoom and blend live, right in the browser
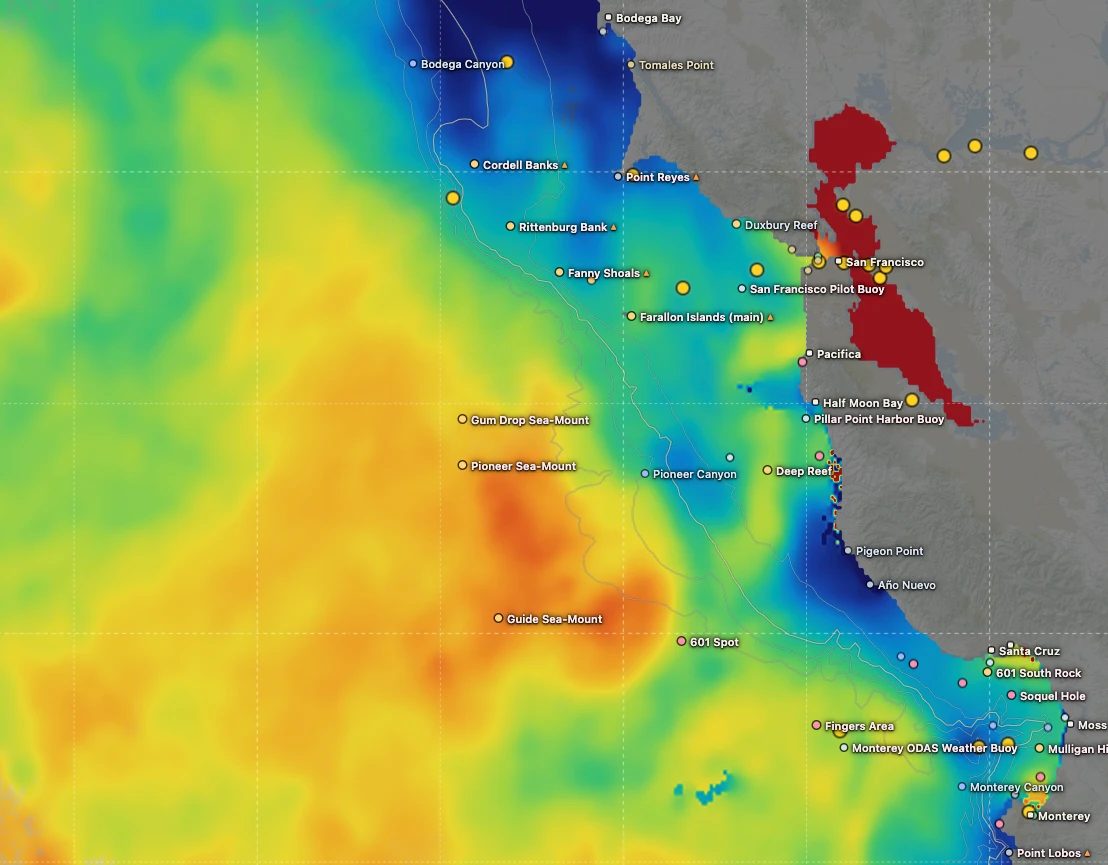 the break — fish stack here
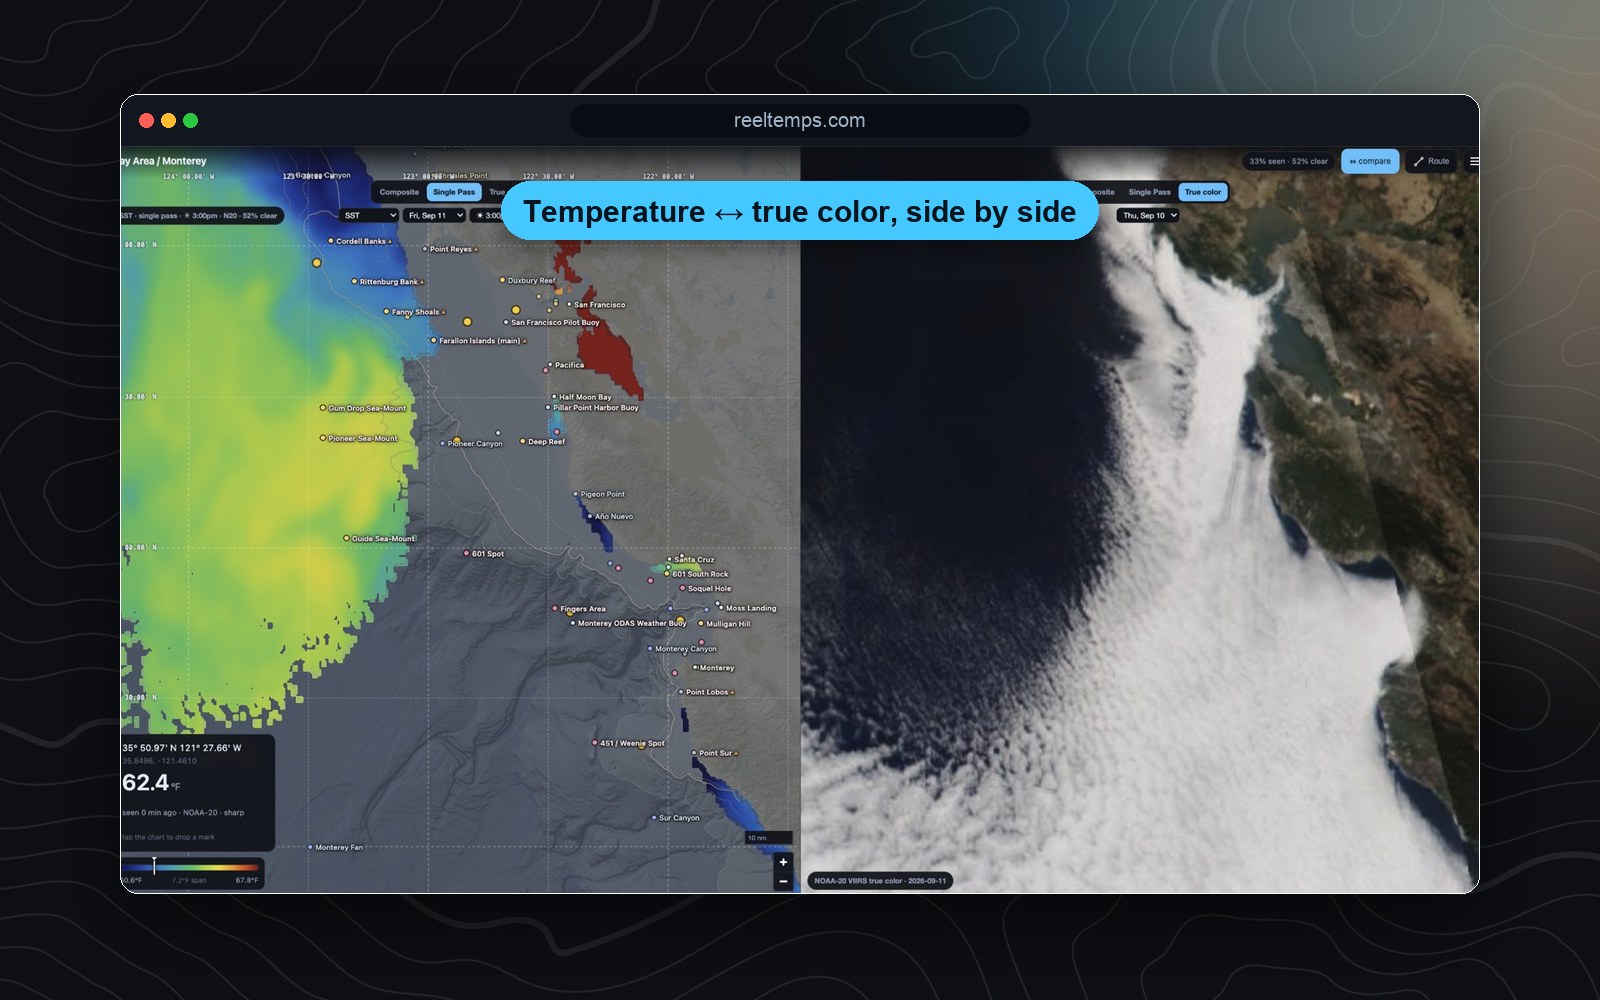
Temperature and true color, together.
Split the screen and line the temperature break up against the true-color image from orbit — read the water two ways at once, on one synced camera and one cursor.
- Compare SST against true color
- Single pass or composite, your call
- One readout across both panes
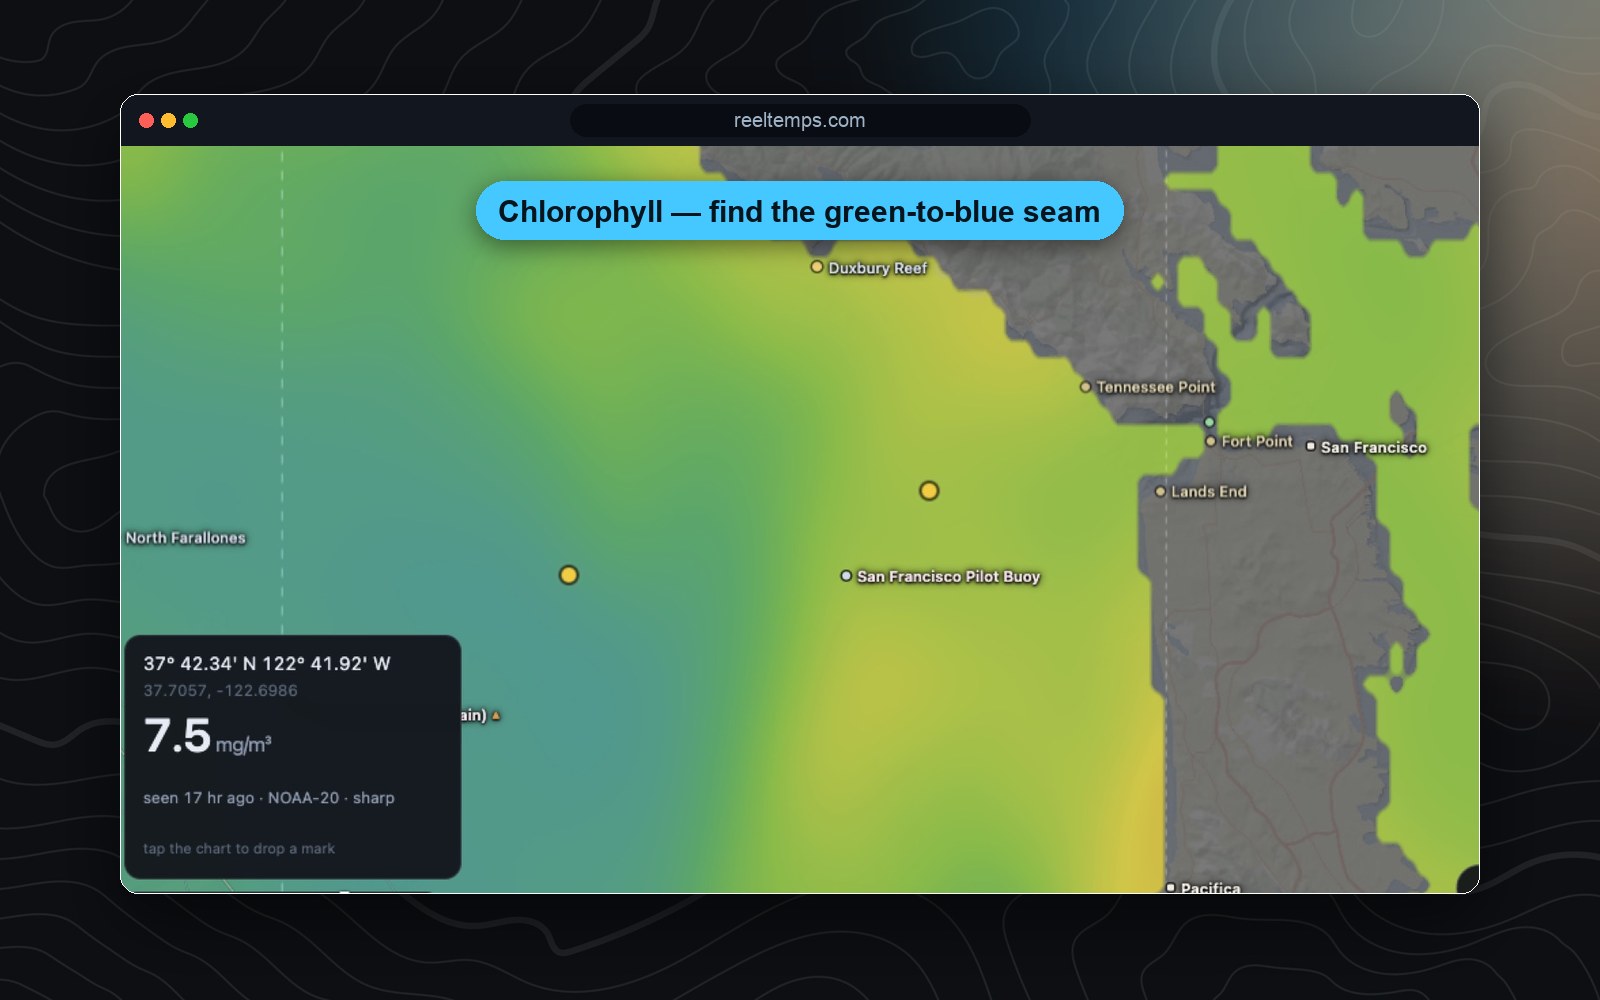
Find the color change and the bait.
Chlorophyll-a on the same map and the same tools — work the seam where the green water meets the blue and the bait stacks up.
- Chlorophyll-a bloom edges
- Concentration readout in mg/m³
- Line it up against the temperature break
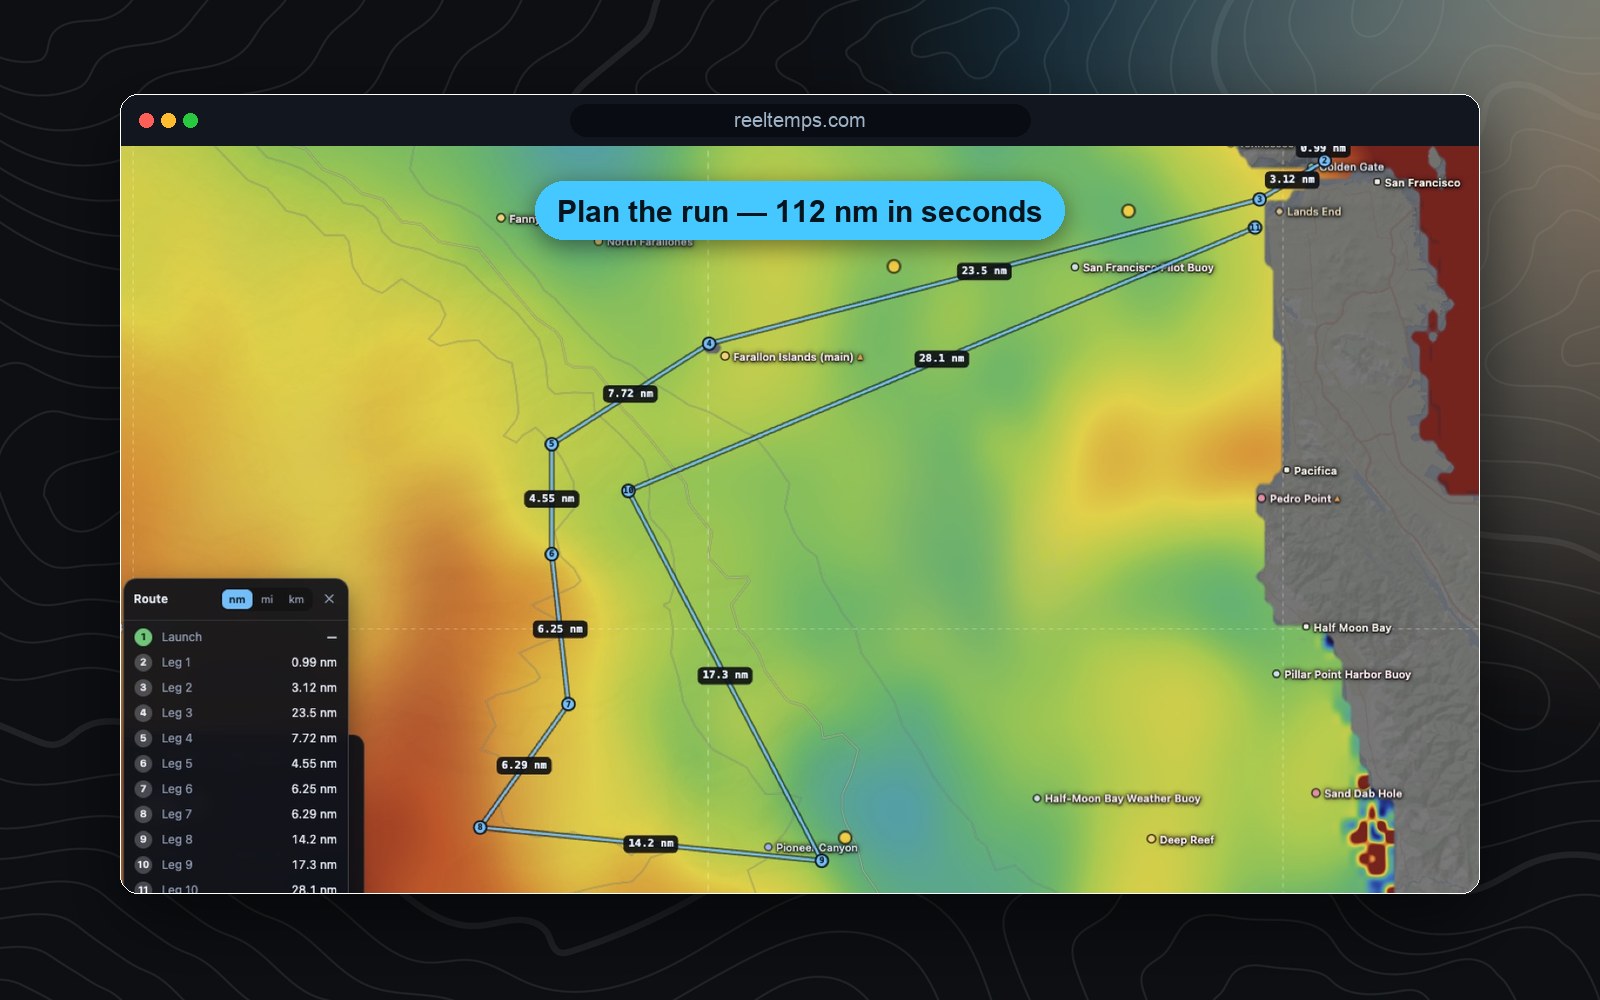
Lay the course. Measure the run.
Drop a route across the break, measure the distance and bearing of every leg, and save the marks — then export them as plain text your plotter can read. The planning you'd do on paper, done on the chart.
- Route, ruler & savable waypoints
- Export to your plotter as plain text
- Your units (°F/°C) and GPS format everywhere
Found the break? Now pick the day.
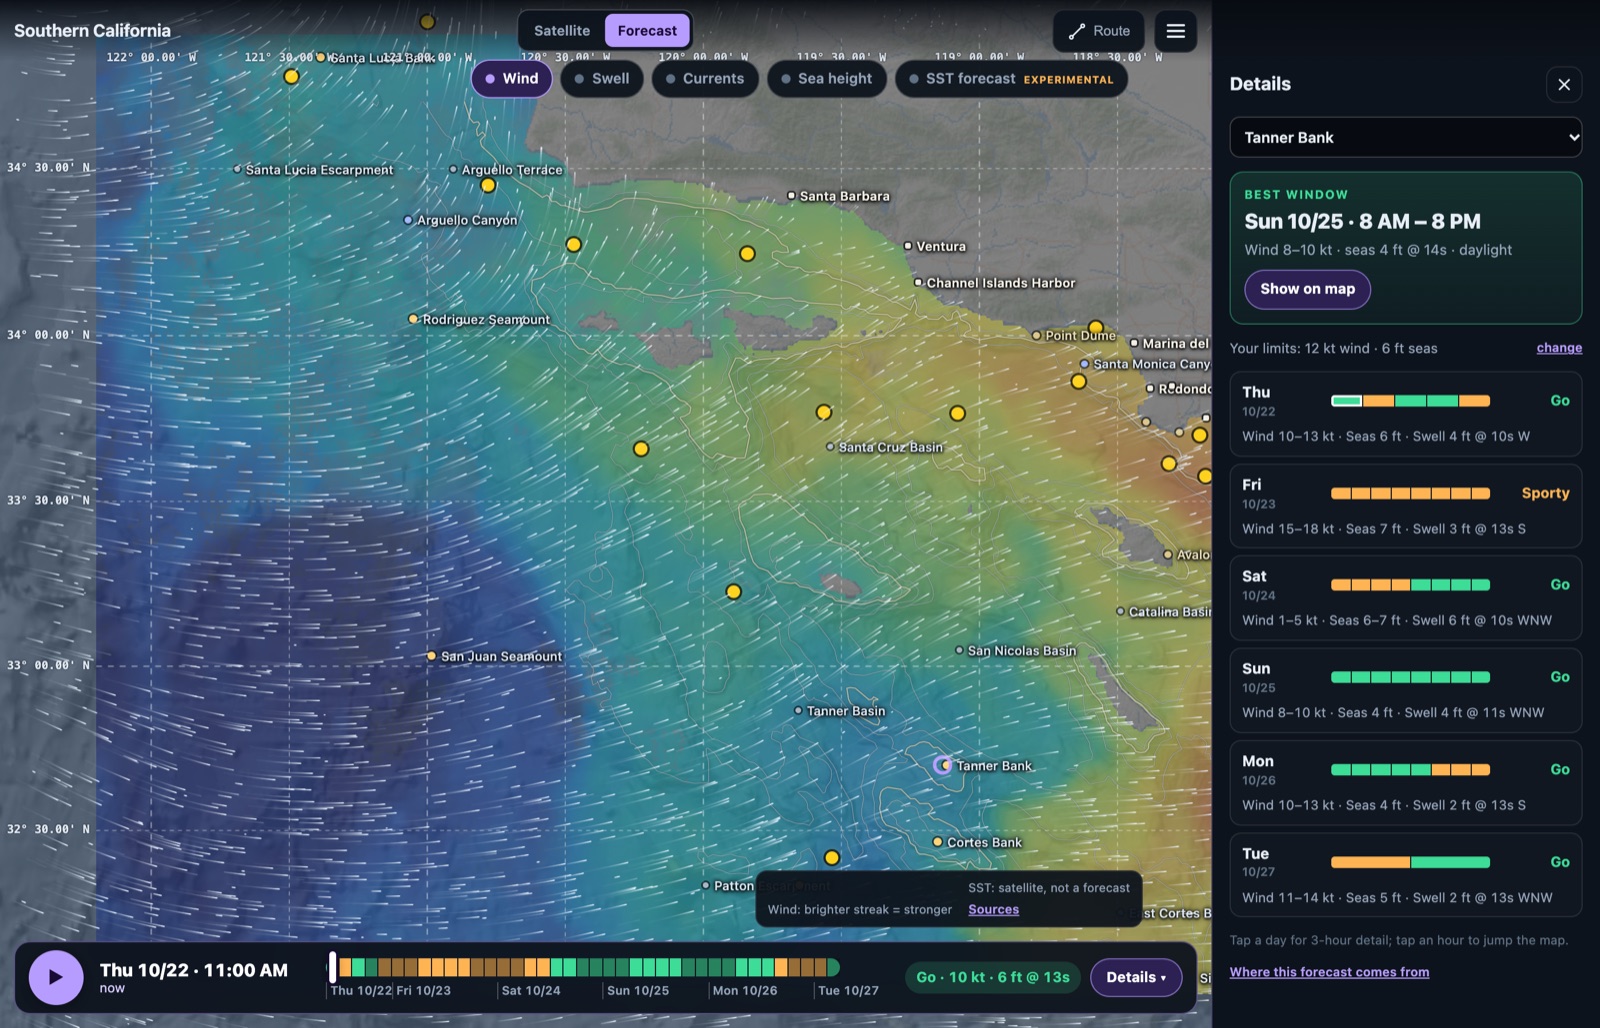
Choose the spot you want to fish, a bank, a canyon or your own waypoint, and ReelTemps scores the next five days against your limits for wind and seas. Green means go. It even calls out the best window, so you know when to leave the dock, not just where to point the boat.
- Go / sporty / no-go for your exact spot, hour by hour
- Best weather window, picked for you
- Set your own wind and sea limits for your boat
The whole picture, every season.
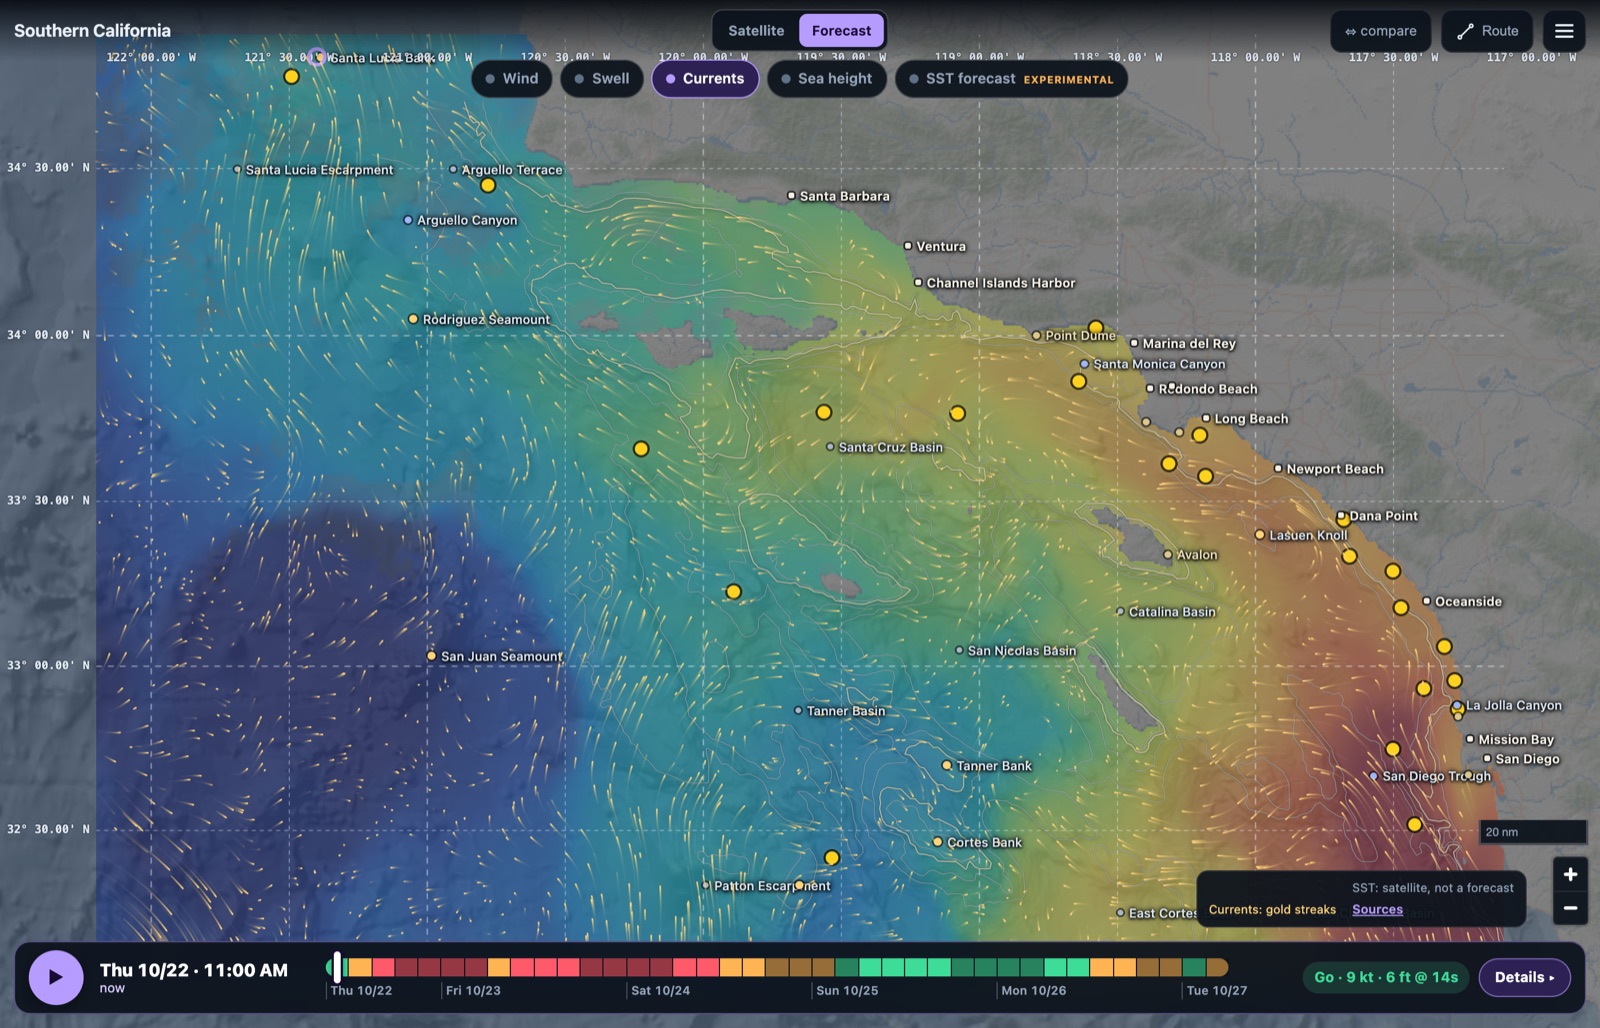
Wind and swell for the next five days, plus currents and sea height on the West Coast, drawn right over the water you're reading. Scrub the timeline to watch a front roll through or the current set up along the break. It's not just a summer tuna tool: plan every trip, all year.
- 5-day wind and swell forecast
- Currents and sea height on the West Coast, more coming
- Wave heights corrected to the NOAA buoys
- One timeline, one map, the chart underneath
Everything, in every region.
One membership. No tiers, no per-layer paywalls, no per-region upsells.
- Recency-weighted compositeDays of passes, blended by freshness, outliers rejected.
- Single-pass & cloud-freeEvery overpass, plus a modeled clear-sky layer.
- True-color imageryWhat the water actually looks like from orbit.
- Chlorophyll-aColor changes and bloom edges on the same map.
- Route, ruler & waypointsPlan the run and export to your plotter.
- 5-day marine forecastWind and swell over the chart, plus currents out West.
- Go/no-go for your spotScored to your limits, with the best window picked.
- Buoy-calibratedOptional correction to the NDBC buoys.
- Phone, tablet & desktopRenders in the browser — fast, on any device.
- Your units & grid°F/°C and DDM, DMS or decimal degrees.
From the U.S. coast to the Caribbean.
The entire Lower 48 shoreline, Hawaii, all five Great Lakes, Baja and mainland Mexico, and now the Caribbean. That is 53 regions, refreshed around the clock, and one membership unlocks them all.
Pacific, Hawaii & Baja
- Washington
- Oregon
- Northern California
- Central California
- Southern California
- Maui & Big Island
- Oʻahu & Kauaʻi
- La Paz / Cerralvo
- Los Cabos / East Cape
Northeast Atlantic
- Gulf of Maine
- Cape Cod & Georges Bank
- NE Canyons — North
- Mid-Atlantic & South Canyons
- North Carolina
- SC & Georgia
Southeast & Gulf
- Jacksonville–St. Augustine
- Cape Canaveral–Ft. Pierce
- Stuart–Jupiter
- Miami–Bimini
- Florida Keys
- Tampa · Ft. Myers · Big Bend
- Panhandle · Louisiana · Texas
Great Lakes
- Lake Superior
- Lake Michigan
- Lake Huron
- Lake Erie & St. Clair
- Lake Ontario
Trusted by the captains who fish it.
What crews running the Pacific tuna grounds are saying.
I've tried every temp map out there and they all feel like they were built ten years ago. I'm not exactly a tech guy, but this one actually makes sense the second you open it. First time using it, I marked a break in about 30 seconds the night before and boated bluefin right on it the next morning.
Used to burn half a tank driving around looking for color change or a solid temp break. Now I check ReelTemps before I leave the dock and I know exactly where I'm going. Less time driving around guessing, more time with lines in the water.
Albacore season used to mean a couple hours of homework the night before and just hoping it held up. Now I do most of my research that morning and pull it up on my phone if things change once we're out there. Makes calling an audible a lot easier.
Founding-member reviews — more rolling in as the season opens.
One plan. Every region.
Try the full product in the live demo, then unlock every region and every layer for a year.
Have a creator code? Save $25 — pay $74.99 your first year.
- ✓ Unlimited use — every region, every layer
- ✓ Live charts, updated throughout the day
- ✓ SST, chlorophyll, cloud-free and true-color
- ✓ Composites, single-pass stepping and compare
- ✓ 5-day marine forecast with go/no-go for your spot
- ✓ Route, ruler and savable waypoints
- ✓ Buoy calibration, your units and GPS format
- ✓ Phone, tablet and desktop
Not sure yet? Explore the live demo first →
See the break before you burn the fuel.
The demo is the real product on real satellite data. Open it, run the tools, and decide for yourself.